Live Nation Entertainment Reports Full Year And Fourth Quarter 2023 Results
“The live music industry reached new heights in 2023, and demand for live music continues to build. Our digital world empowers artists to develop global followings, while inspiring fans to crave in-person experiences more than ever. At the same time, the industry is delivering a wider variety of concerts which draws in new audiences, and developing more venues to support a larger show pipeline. Against this backdrop, we expect all our businesses to continue growing and adding value to artists and fans as we deliver double-digit operating income and AOI growth again this year, with our profitability compounding by double-digits over the next several years.”
–Michael Rapino, President and CEO, Live Nation Entertainment
2023 Financial Overview (vs FY 2022): Global Demand for Live Events Drives Ongoing Growth
(reported FX)
- Revenue up 36% to $22.7 billion
- Operating Income up 46% to $1.07 billion
- AOI up 32% to $1.86 billion, doubling since 2019
- Operating Cash Flow of nearly $1.4 billion
- Free Cash Flow — Adjusted of over $1.1 billion, up 20% and converting 62% of AOI
- EPS more than doubled to $1.37
View how these results compare to past quarters in the 4Q23 Trended Results Grid:
https://investors.livenationentertainment.com/financial-information/financial-results
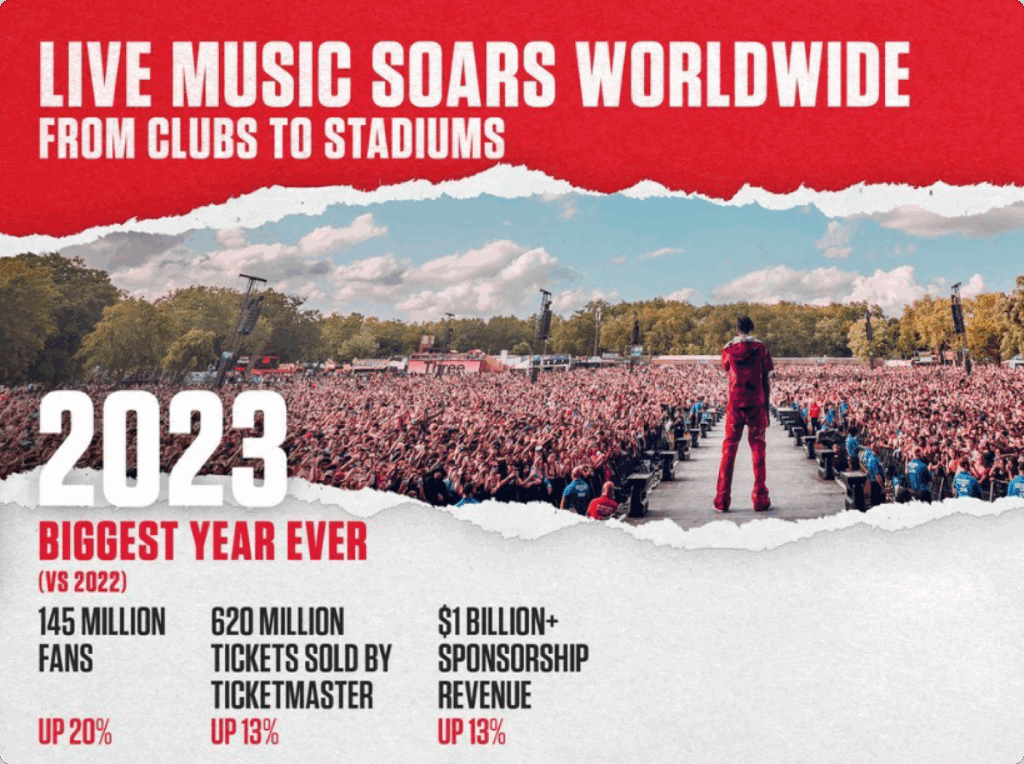
2023 Highlights (vs FY 2022): All-Time Highs for Attendance, Ticket Sales, and Sponsorship Activity
- More fans: Concert attendance up 20%, over 145 million fans attended over 50,000 events
- More global and longer: 50% more international acts in top 50 tours and tours have 15% more shows on average (both compared to five years ago)
- Higher spending on hospitality: Ancillary per fan spending up double-digits across all major venue types – amphitheaters, festivals, and clubs and theaters
- Greater ticket sales: Fee-bearing gross transaction value (GTV) up 30% to nearly $36 billion
- Growing brand demand: Sponsorship revenue up 13% to over $1 billion
- Live Nation remains the largest supporter of artists: Investment in artists up over 40% to over $13 billion
- Promoting more artists at every level from clubs to stadiums, with nearly 7,000 touring artists in 40+ countries
- Paid out $1,500 nightly bonuses and 100% merchandise profits to over 3,000 developing artists through our On The Road Again program, which has extended to 2024
2024 Strong Start (vs same period 2023): Leading Indicators Point to Another Year of Growth
(based on leading indicators through mid-February)
- Fans prioritize live: Social media fuels fan interest, with approximately 90% of live music goers agreeing that seeing live music content on social media makes them want to attend shows
- Live Nation concert ticket sales pacing up 6% with 57 million tickets sold for shows this year, and arena and amphitheater sales up double-digits
- Strong demand across all price points: Front of house continues to see high demand and ticket sales up 25% for the 2024 Lawnie Pass
- Show pipeline up: Confirmed shows for large venues (stadiums, arenas, and amphitheaters) up double-digits with growth led by arenas and amphitheaters
- 65% of full-year booked compared to approximately 50% booked last year
- Venue Nation fan count expected to grow with more shows at amphitheaters and other operated venues
- Event-related deferred revenue at year end up 8% to $2.9 billion
- Strong momentum at Ticketmaster: GTV up double-digits to $13 billion on fee-bearing tickets for events playing off in 2024
- Approximately three million net new enterprise tickets signed in January, with two-thirds from International markets
- All-in pricing winning fans: Move to all-in pricing last fall receiving positive reception and driving higher conversion rates across our operated venues
- Sponsorship momentum continues: Approximately 75% of expected sponsorship commitments booked, up double-digits
- Long-term monetization driven by opportunities across Latin America and Asia, expanding venue and festival footprint including premium experiences, and Ticketmaster’s global platform including digital ticketing

2023 Concerts Demand on the Rise Globally (vs FY 2022)
- Revenue up 39% to $18.8 billion
- AOI approximately doubled to $325 million
- Full-year margins expanded by 50 basis points, despite most fan growth coming in third-party venues
Demand Increasing Attendance Across All Markets, Venues, and Price Points (vs FY 2022)
- Overall fan growth of 20% led by International markets up 25% and North America up 17%
- Stadium shows led attendance growth with over 29 million fans globally, up 60%
- Wide variety of price points with two-thirds of U.S. concert tickets under $100 and one-third under $50
- Average secondary ticket price roughly 2x primary, showing that tickets remain priced below market value

Venue Nation Continues to Elevate On-Site Experiences (vs FY 2022)
- Over 55 million fans at our operated venues and festivals, up 13%
- Ancillary per fan revenue grew double-digits at operated venues as fans prioritize spending on enhanced hospitality:
- Amphitheaters up 10% to over $40
- Arenas and theaters and clubs up double-digits globally
- Major festivals (over 100k attendees) up double-digits globally
- Expanding global venue portfolio with a focus on large theaters and international arenas

Global Fan Demand and Client Wins Drive 2023 Ticketing Results (vs FY 2022)
- Revenue up 32% to nearly $3 billion
- AOI up 35% to over $1.1 billion
- Full-year margins remained in the high 30s
Live Experience Economy Fuels More Ticket Sales (vs FY 2022)
- Total fee-bearing GTV up 30% to $36 billion, with North America up 26% and International markets up 42%; 85% of the growth driven by global concert ticket sales
- Total tickets up 13% to over 620 million tickets, including fee-bearing tickets up 17% to 329 million
- 21 million net new client tickets added, with approximately 80% coming from International markets

Sponsorship Growth Reflects the Scale and Unique Nature of Our Global Platforms (vs FY 2022)
- Revenue up 13% to over $1 billion
- AOI up 14% to $675 million
- Full-year margins remained in the low 60s
- Over 100 partners with multi-million dollar, multi-year commitments accounted for approximately 80% of revenue
- Growth led by beverages, technology, and financial services
– – – – – – – – –
Additional Financial Information
- 2024 growth expected to be more weighted toward 2Q and 3Q compared to previous years
- 2024 capital expenditures estimated to be $540 million, in line with prior years as a percentage of revenue
- Approximately two-thirds will support revenue-generating projects, driven primarily by the expansion of and investment in our global venue portfolio
- Four venues account for approximately one-third of this spend with total expected returns over 20%
- Foreign exchange rates not currently expected to materially impact 2024 revenue, operating income or AOI
- Below-the-line impact to 2024 EPS:
- Depreciation and amortization expense expected to be $80 million higher than 2023
- Annual accretion expected to grow in line with AOI
- Non-controlling interest and tax expenses expected to grow in line with AOI
- 2024 share count not expected to change materially from 2023
Balance Sheet and Liquidity Gives Us Financial Flexibility
- 4Q23 ended with $6.2 billion in cash and cash equivalents, including $1.5 billion in ticketing client cash and $2.2 billion in free cash
- Approximately 87% of debt is at a fixed rate, with an average cost of debt of 4.7%
The company will webcast a teleconference today at 2:00 p.m. Pacific Time to discuss its financial performance, operational matters and potentially other material developments. Interested parties should visit the “News / Events” section of the company’s website at investors.livenationentertainment.com to listen to the webcast. Supplemental statistical and financial information to be provided on the call, if any, will be posted to the “Financial Info” section of the website. A replay of the webcast will also be available on the Live Nation website. The link to the 4Q23 Trended Results Grid is provided above for convenience and such grid is not a part of, or incorporated into, this press release or any SEC filings that include this press release.
Notice Regarding Financial Statements
The company has provided certain financial statements at the end of this press release for reference. These financial statements should be read in conjunction with the full financial statements, and the notes thereto, set forth in the company’s Annual Report on Form 10-K filed with the Securities and Exchange Commission today and available on the SEC’s website at sec.gov.
About Live Nation Entertainment:
Live Nation Entertainment, Inc. (NYSE: LYV) is the world’s leading live entertainment company comprised of global market leaders: Ticketmaster, Live Nation Concerts, and Live Nation Media & Sponsorship. For additional information, visit investors.livenationentertainment.com.
FINANCIAL HIGHLIGHTS – FOURTH QUARTER
(unaudited; $ in millions)
| Q4 2023 Reported | Q4 2022 Reported | Growth | Q4 2023 Constant Currency | Growth at Constant Currency | |
|---|---|---|---|---|---|
| Revenue | |||||
| Concerts | $ 4,874.8 | $ 3,395.9 | 44 % | $ 4,924.7 | 45 % |
| Ticketing | 739.8 | 651.3 | 14 % | 737.3 | 13 % |
| Sponsorship & Advertising | 255.4 | 245.6 | 4 % | 252.6 | 3 % |
| Other and Eliminations | (31.1) | (2.2) | * | (31.1) | * |
| Total Revenue | $ 5,838.9 | $ 4,290.6 | 36 % | $ 5,883.5 | 37 % |
| Consolidated Operating Loss | $ (81.5) | $ (119.9) | 32 % | $ (95.1) | 21 % |
| Adjusted Operating Income (Loss) | |||||
| Concerts | $ (184.4) | $ (184.8) | — % | $ (204.9) | (11 %) |
| Ticketing | 236.0 | 227.7 | 4 % | 237.0 | 4 % |
| Sponsorship & Advertising | 126.2 | 117.7 | 7 % | 127.5 | 8 % |
| Other and Eliminations | (6.6) | (4.7) | * | (6.6) | * |
| Corporate | (54.3) | (58.1) | 7 % | (54.3) | 7 % |
| Total Adjusted Operating Income (Loss) | $ 116.9 | $ 97.8 | 20 % | $ 98.7 | 1 % |
* Percentages are not meaningful
FINANCIAL HIGHLIGHTS – 12 MONTHS
(unaudited; $ in millions)
| 12 Months 2023 Reported | 12 Months 2022 Reported | Growth | 12 Months 2023 Constant Currency | Growth at Constant Currency | |
|---|---|---|---|---|---|
| Revenue | |||||
| Concerts | $ 18,763.7 | $ 13,494.1 | 39 % | $ 18,724.4 | 39 % |
| Ticketing | 2,959.5 | 2,238.6 | 32 % | 2,953.3 | 32 % |
| Sponsorship & Advertising | 1,095.2 | 968.1 | 13 % | 1,077.6 | 11 % |
| Other and Eliminations | (69.3) | (19.6) | * | (69.3) | * |
| Total Revenue | $ 22,749.1 | $ 16,681.2 | 36 % | $ 22,686.0 | 36 % |
| Consolidated Operating Income | $ 1,066.2 | $ 732.1 | 46 % | $ 1,036.6 | 42 % |
| Adjusted Operating Income (Loss) | |||||
| Concerts | $ 325.5 | $ 169.7 | 92 % | $ 292.8 | 72 % |
| Ticketing | 1,116.3 | 827.9 | 35 % | 1,112.3 | 34 % |
| Sponsorship & Advertising | 675.1 | 592.0 | 14 % | 669.0 | 13 % |
| Other and Eliminations | (39.5) | (14.5) | * | (39.5) | * |
| Corporate | (215.0) | (167.9) | (28) % | (215.0) | (28) % |
| Total Adjusted Operating Income (Loss) | $ 1,862.4 | $ 1,407.2 | 32 % | $ 1,819.6 | 29 % |
* Percentages are not meaningful
Reconciliation of Operating Income (Loss) to Adjusted Operating Income (Unaudited)
| Q4 2023 | Q4 2022 | 12 Months 2023 | 12 Months 2022 | |
|---|---|---|---|---|
| (in millions) | ||||
| Operating Income (Loss) | $ (81.5) | $ (119.9) | $ 1,066.2 | $ 732.1 |
| Acquisition expenses | 14.5 | 38.9 | 93.6 | 68.2 |
| Amortization of non-recoupable ticketing contract advances | 25.2 | 22.9 | 83.7 | 79.0 |
| Depreciation and amortization | 134.4 | 131.5 | 516.8 | 450.0 |
| Loss (gain) on sale of operating assets | (5.8) | 0.5 | (13.9) | (32.1) |
| Stock-based compensation expense | 30.1 | 23.9 | 116.0 | 110.0 |
| Adjusted Operating Income | $ 116.9 | $ 97.8 | $ 1,862.4 | $ 1,407.2 |
KEY OPERATING METRICS
(unaudited)
| Q4 2023 | Q4 2022 | 12 Months 2023 | 12 Months 2022 | |
|---|---|---|---|---|
| (in thousands except estimated events) | ||||
| Concerts (1) | ||||
| Estimated events: | ||||
| North America | 10,129 | 8,110 | 33,629 | 29,170 |
| International | 5,694 | 5,046 | 16,430 | 14,475 |
| Total estimated events | 15,823 | 13,156 | 50,059 | 43,645 |
| Estimated fans: | ||||
| North America | 20,928 | 16,251 | 81,252 | 69,693 |
| International | 16,612 | 15,758 | 64,538 | 51,459 |
| Total estimated fans | 37,540 | 32,009 | 145,790 | 121,152 |
| Ticketing (2) | ||||
| Estimated number of fee-bearing tickets | 88,670 | 83,955 | 329,116 | 280,862 |
| Estimated number of non-fee-bearing tickets | 80,777 | 80,151 | 291,295 | 269,814 |
| Total estimated tickets sold | 169,447 | 164,106 | 620,411 | 550,676 |
Reconciliation of Certain Non-GAAP Measures to Their Most Directly Comparable GAAP Measures
(Unaudited)
Reconciliation of Free Cash Flow — Adjusted to Net Cash Provided by Operating Activities
($ in millions)
| Q4 2023 | Q4 2022 | |
|---|---|---|
| Net cash provided by operating activities | $ 608.4 | $ 903.7 |
| Less: Changes in operating assets and liabilities (working capital) | (568.0) | (844.3) |
| Free cash flow from earnings | $ 40.4 | $ 59.4 |
| Less: Maintenance capital expenditures | (59.4) | (70.2) |
| Distributions to noncontrolling interests | (85.8) | (18.8) |
| Free cash flow — adjusted | $ (104.8) | $ (29.6) |
| Net cash used in investing activities | $ (231.8) | $ (425.0) |
| Net cash provided by (used in) financing activities | $ (132.2) | $ 31.9 |
Reconciliation of Free Cash Flow — Adjusted to Net Cash Provided by Operating Activities
($ in millions)
| 12 Months 2023 | 12 Months 2022 | |
|---|---|---|
| Net cash provided by operating activities | $ 1,370.8 | $ 1,832.1 |
| Less: Changes in operating assets and liabilities (working capital) | 160.0 | (637.9) |
| Free cash flow from earnings | $ 1,530.8 | $ 1,194.2 |
| Less: Maintenance capital expenditures | (131.9) | (127.0) |
| Distributions to noncontrolling interests | (239.6) | (100.7) |
| Free cash flow — adjusted | $ 1,159.3 | $ 966.5 |
| Net cash used in investing activities | $ (695.8) | $ (784.7) |
| Net cash used in financing activities | $ (87.3) | $ (143.3) |
Reconciliation of Free Cash to Cash and Cash Equivalents
($ in millions)
| December 31, 2023 | |
|---|---|
| Cash and cash equivalents | $ 6,231.9 |
| Client cash | (1,483.7) |
| Deferred revenue — event-related | (2,947.4) |
| Accrued artist fees | (215.9) |
| Collections on behalf of others | (82.3) |
| Prepaid expenses — event-related | 695.0 |
| Free cash | $ 2,197.6 |
Forward-Looking Statements, Non-GAAP Financial Measures and Reconciliations:
Certain statements in this press release, including the Supplemental Information that follows, constitute “forward-looking statements” within the meaning of the Private Securities Litigation Reform Act of 1995. Such forward-looking statements include, but are not limited to statements the regarding leading indicators pointing to another year of growth for the company in 2024; the company’s current expectation that all of its businesses will continue to grow, with anticipated double-digit operating income and adjusted operating income growth in 2024, with profitability expected to compound by double-digits over the next several years; expected growth in Venue Nation fan count; continued momentum for the company’s sponsorship business and the drivers for long-term monetization in this business; the company’s estimated capital expenditures for 2024; the company’s expectations for depreciation and amortization expense, annual accretion, and non-controlling interest and tax expenses in 2024; the company’s expectation that 2024 growth will be more weighted toward the second and third quarters compared to previous years; current expectations that foreign exchange rates will not materially impact 2024 revenue, operating income or adjusted operating income; and current expectations that 2024 share count will not change materially from 2023.
Live Nation wishes to caution you that there are some known and unknown factors that could cause actual results to differ materially from any future results, performance or achievements expressed or implied by such forward-looking statements, including but not limited to operational challenges in achieving strategic objectives and executing on the company’s plans, the risk that the company’s markets do not evolve as anticipated, the potential impact of any economic slowdown and operational challenges associated with selling tickets and staging events.
Live Nation refers you to the documents it files from time to time with the U.S. Securities and Exchange Commission, or SEC, specifically the section titled “Item 1A. Risk Factors” of the company’s most recent Annual Report filed on Form 10-K, and Quarterly Reports on Form 10-Q and its Current Reports on Form 8-K, which contain and identify other important factors that could cause actual results to differ materially from those contained in the company’s projections or forward-looking statements. You are cautioned not to place undue reliance on these forward-looking statements which speak only as of the date on which they are made. All subsequent written and oral forward-looking statements by or concerning Live Nation are expressly qualified in their entirety by the cautionary statements above. Live Nation does not undertake any obligation to publicly update or revise any forward-looking statements because of new information, future events or otherwise.
This press release contains certain non-GAAP financial measures as defined by SEC Regulation G. A reconciliation of each such measure to its most directly comparable GAAP financial measure, together with an explanation of why management believes that these non-GAAP financial measures provide useful information to investors, is provided herein.
Adjusted Operating Income (Loss), or AOI, is a non-GAAP financial measure that we define as consolidated operating income (loss) before certain acquisition expenses (including transaction costs, changes in the fair value of accrued acquisition-related contingent consideration obligations, and acquisition-related severance and compensation), amortization of non-recoupable ticketing contract advances, depreciation and amortization (including goodwill impairment), loss (gain) on disposal of operating assets, and stock-based compensation expense. We use AOI to evaluate the performance of our operating segments. We believe that information about AOI assists investors by allowing them to evaluate changes in the operating results of our portfolio of businesses separate from non-operational factors that affect net income (loss), thus providing insights into both operations and the other factors that affect reported results. AOI is not calculated or presented in accordance with GAAP. A limitation of the use of AOI as a performance measure is that it does not reflect the periodic costs of certain amortizing assets used in generating revenue in our business. Accordingly, AOI should be considered in addition to, and not as a substitute for, operating income (loss), net income (loss), and other measures of financial performance reported in accordance with GAAP. Furthermore, this measure may vary among other companies; thus, AOI as presented herein may not be comparable to similarly titled measures of other companies.
Constant Currency is a non-GAAP financial measure when applied to a GAAP financial measure. We calculate currency impacts as the difference between current period activity translated using the current period’s currency exchange rates and the comparable prior period’s currency exchange rates. We present constant currency information to provide a framework for assessing how our underlying businesses performed excluding the effect of foreign currency rate fluctuations.
Free Cash Flow — Adjusted, or FCF, is a non-GAAP financial measure that we define as net cash provided by (used in) operating activities less changes in operating assets and liabilities, less maintenance capital expenditures, less distributions to noncontrolling interest partners. We use FCF among other measures, to evaluate the ability of operations to generate cash that is available for purposes other than maintenance capital expenditures. We believe that information about FCF provides investors with an important perspective on the cash available to service debt, make acquisitions, and for revenue generating capital expenditures. FCF is not calculated or presented in accordance with GAAP. A limitation of the use of FCF as a performance measure is that it does not necessarily represent funds available for operations and is not necessarily a measure of our ability to fund our cash needs. Accordingly, FCF should be considered in addition to, and not as a substitute for, net cash provided by (used in) operating activities and other measures of financial performance reported in accordance with GAAP. Furthermore, this measure may vary among other companies; thus, FCF as presented herein may not be comparable to similarly titled measures of other companies.
Free Cash is a non-GAAP financial measure that we define as cash and cash equivalents less ticketing-related client funds, less event-related deferred revenue, less accrued expenses due to artists and cash collected on behalf of others, plus event-related prepaids. We use free cash as a proxy for how much cash we have available to, among other things, optionally repay debt balances, make acquisitions and fund revenue generating capital expenditures. Free cash is not calculated or presented in accordance with GAAP. A limitation of the use of free cash as a performance measure is that it does not necessarily represent funds available from operations and it is not necessarily a measure of our ability to fund our cash needs. Accordingly, free cash should be considered in addition to, and not as a substitute for, cash and cash equivalents and other measures of financial performance reported in accordance with GAAP. Furthermore, this measure may vary among other companies; thus, free cash as presented herein may not be comparable to similarly titled measures of other companies.
LIVE NATION ENTERTAINMENT, INC.
CONSOLIDATED BALANCE SHEETS
(in thousands)
| December 31, 2023 | December 31, 2022 | |
|---|---|---|
| ASSETS | ||
| Current assets | ||
| Cash and cash equivalents | $ 6,231,866 | $ 5,606,457 |
| Accounts receivable, less allowance of $82,350 and $63,294, respectively | 2,069,054 | 1,465,383 |
| Prepaid expenses | 1,147,581 | 949,826 |
| Restricted cash | 7,090 | 5,917 |
| Other current assets | 122,163 | 131,939 |
| Total current assets | 9,577,754 | 8,159,522 |
| Property, plant and equipment, net | 2,101,463 | 1,487,663 |
| Operating lease assets | 1,606,389 | 1,571,395 |
| Intangible assets | ||
| Definite-lived intangible assets, net | 1,161,621 | 1,050,622 |
| Indefinite-lived intangible assets, net | 377,349 | 368,712 |
| Goodwill | 2,691,466 | 2,529,380 |
| Long-term advances | 623,154 | 568,558 |
| Other long-term assets | 934,849 | 724,989 |
| Total assets | $ 19,074,045 | $ 16,460,841 |
| LIABILITIES AND EQUITY | ||
| Current liabilities | ||
| Accounts payable, client accounts | $ 1,866,864 | $ 1,791,025 |
| Accounts payable | 267,493 | 180,076 |
| Accrued expenses | 3,006,281 | 2,368,434 |
| Deferred revenue | 3,398,028 | 3,134,800 |
| Current portion of long-term debt, net | 1,134,386 | 620,032 |
| Current portion of operating lease liabilities | 158,421 | 140,232 |
| Other current liabilities | 128,430 | 68,716 |
| Total current liabilities | 9,959,903 | 8,303,315 |
| Long-term debt, net | 5,459,026 | 5,283,467 |
| Long-term operating lease liabilities | 1,686,091 | 1,654,525 |
| Other long-term liabilities | 488,159 | 455,971 |
| Commitments and contingent liabilities | ||
| Redeemable noncontrolling interests | 893,709 | 669,766 |
| Stockholders’ equity | ||
| Preferred stock—Series A Junior Participating, $0.01 par value; 20,000,000 shares authorized; no shares issued and outstanding | — | — |
| Preferred stock, $0.01 par value; 30,000,000 shares authorized; no shares issued and outstanding | — | — |
| Common stock, $0.01 par value; 450,000,000 shares authorized; 233,711,176 and 231,671,647 shares issued and 233,303,152 and 231,263,623 shares outstanding in 2023 and 2022, respectively | 2,298 | 2,285 |
| Additional paid-in capital | 2,367,918 | 2,698,316 |
| Accumulated deficit | (2,407,949) | (2,971,229) |
| Cost of shares held in treasury | (6,865) | (6,865) |
| Accumulated other comprehensive income (loss) | 27,450 | (90,076) |
| Total Live Nation stockholders’ equity | (17,148) | (367,569) |
| Noncontrolling interests | 604,305 | 461,366 |
| Total equity | 587,157 | 93,797 |
| Total liabilities and equity | $ 19,074,045 | $ 16,460,841 |
LIVE NATION ENTERTAINMENT, INC.
CONSOLIDATED STATEMENTS OF OPERATIONS
(in thousands, except share and per share data)
| 2023 | 2022 | 2021 | |
|---|---|---|---|
| Revenue | $ 22,749,073 | $ 16,681,254 | $ 6,268,447 |
| Operating expenses: | |||
| Direct operating expenses | 17,292,016 | 12,337,524 | 4,355,989 |
| Selling, general and administrative expenses | 3,557,167 | 2,955,884 | 1,754,822 |
| Depreciation and amortization | 516,797 | 449,976 | 416,277 |
| Gain on disposal of operating assets | (13,927) | (32,082) | (1,211) |
| Corporate expenses | 330,817 | 237,834 | 160,428 |
| Operating income (loss) | 1,066,203 | 732,118 | (417,858) |
| Interest expense | 350,244 | 278,483 | 282,440 |
| Loss on extinguishment of debt | 18,504 | — | — |
| Interest income | (237,818) | (77,620) | (6,625) |
| Equity in losses (earnings) of nonconsolidated affiliates | 5,455 | (10,571) | (2,520) |
| Loss (gain) from sale of investments in nonconsolidated affiliates | 341 | (448) | (83,578) |
| Other expense, net | 34,933 | 36,827 | 3,692 |
| Income (loss) before income taxes | 894,544 | 505,447 | (611,267) |
| Income tax expense (benefit) | 160,227 | 96,254 | (2,481) |
| Net income (loss) | 734,317 | 409,193 | (608,786) |
| Net income attributable to noncontrolling interests | 171,037 | 113,207 | 42,118 |
| Net income (loss) attributable to common stockholders of Live Nation | $ 563,280 | $ 295,986 | $ (650,904) |
| Basic net income (loss) per common share available to common stockholders of Live Nation | |||
| $ 1.38 | $ 0.66 | $ (3.09) | |
| Diluted net income (loss) per common share available to common stockholders of Live Nation | |||
| $ 1.37 | $ 0.64 | $ (3.09) | |
| Weighted average common shares outstanding: | |||
| Basic | 228,628,390 | 224,809,558 | 217,190,862 |
| Diluted | 230,977,326 | 231,556,866 | 217,190,862 |
| Reconciliation to net income (loss) available to common stockholders of Live Nation: | |||
| Net income (loss) attributable to common stockholders of Live Nation | $ 563,280 | $ 295,986 | $ (650,904) |
| Accretion of redeemable noncontrolling interests | (247,438) | (146,770) | (19,771) |
| Net income (loss) available to common stockholders of Live Nation — basic and diluted | $ 315,842 | $ 149,216 | $ (670,675) |
LIVE NATION ENTERTAINMENT, INC.
CONSOLIDATED STATEMENTS OF CASH FLOWS
(in thousands)
| 2023 | 2022 | 2021 | |
|---|---|---|---|
| CASH FLOWS FROM OPERATING ACTIVITIES | |||
| Net income | $ 734,317 | $ 409,193 | $ (608,786) |
| Depreciation | 266,590 | 225,770 | 222,840 |
| Amortization of definite-lived intangibles and indefinite-lived intangibles impairment loss | 250,207 | 224,206 | 193,437 |
| Amortization of non-recoupable ticketing contract advances | 83,693 | 79,043 | 74,406 |
| Deferred income tax expense (benefit) | (44,018) | 7,199 | (9,639) |
| Amortization of debt issuance costs and discounts | 16,884 | 16,448 | 37,260 |
| Provision for uncollectible accounts receivable | 78,336 | 68,612 | (17,826) |
| Loss on extinguishment of debt | 18,504 | — | — |
| Stock-based compensation expense | 115,959 | 110,049 | 209,337 |
| Unrealized changes in fair value of contingent consideration | 40,151 | 56,704 | (6,732) |
| Gain on mark-to-market of equity investments | (47,878) | (22,638) | (15,447) |
| Equity in losses of nonconsolidated affiliates, net of distributions | 30,522 | 14,912 | 11,189 |
| Loss (gain) on sale of investments in nonconsolidated affiliates | (979) | 1,357 | (83,578) |
| Other, net | (11,509) | 3,355 | 114 |
| Increase in accounts receivable | (550,670) | (463,977) | (485,211) |
| Decrease (increase) in prepaid expenses and other assets | (202,834) | (267,945) | 95,533 |
| Increase in accounts payable, accrued expenses and other liabilities | 460,496 | 1,002,158 | 1,315,722 |
| Increase in deferred revenue | 133,023 | 367,617 | 847,949 |
| Net cash provided by operating activities | 1,370,794 | 1,832,063 | 1,780,568 |
| CASH FLOWS FROM INVESTING ACTIVITIES | |||
| Advances of notes receivable | (181,801) | (115,992) | (28,899) |
| Collections of notes receivable | 17,057 | 20,527 | 23,835 |
| Investments made in nonconsolidated affiliates | (54,922) | (91,186) | (110,589) |
| Purchases of property, plant and equipment | (438,604) | (347,206) | (152,734) |
| Cash paid for acquisitions, net of cash acquired | (17,534) | (257,191) | (384,251) |
| Purchases of intangible assets | (36,653) | (6,080) | (7,100) |
| Proceeds from sale of investments in nonconsolidated affiliates | 1,524 | 3,863 | 90,432 |
| Other, net | 15,128 | 8,574 | 2,344 |
| Net cash used in investing activities | (695,805) | (784,691) | (566,962) |
| CASH FLOWS FROM FINANCING ACTIVITIES | |||
| Proceeds from long-term debt, net of debt issuance costs | 1,061,026 | 122,251 | 903,827 |
| Payments on long-term debt including extinguishment costs | (730,643) | (45,792) | (109,705) |
| Contributions from noncontrolling interests | 19,602 | 15,021 | 22,026 |
| Distributions to noncontrolling interests | (239,619) | (100,660) | (52,368) |
| Purchases and sales of noncontrolling interests, net | (113,768) | (48,306) | (9,638) |
| Proceeds from sale of common stock, net of issuance costs | — | — | 449,630 |
| Payments for capped call transactions | (75,500) | — | — |
| Proceeds from exercise of stock options | 19,264 | 35,775 | 30,618 |
| Taxes paid for net share settlement of equity awards | (9,484) | (76,925) | (45,845) |
| Payments for deferred and contingent consideration | (17,757) | (44,220) | (17,319) |
| Other, net | (402) | (484) | 106 |
| Net cash provided by (used in) financing activities | (87,281) | (143,340) | 1,171,332 |
| Effect of exchange rate changes on cash, cash equivalents and restricted cash | 38,874 | (179,450) | (43,585) |
| Net increase in cash, cash equivalents, and restricted cash | 626,582 | 724,582 | 2,341,353 |
| Cash, cash equivalents and restricted cash at beginning of period | 5,612,374 | 4,887,792 | 2,546,439 |
| Cash, cash equivalents and restricted cash at end of period | $ 6,238,956 | $ 5,612,374 | $ 4,887,792 |
Contacts
Investor, Amy Yong, [email protected], (310) 867-7143; Media, Kaitlyn Henrich, [email protected]